Gut microbiome and immunotherapy response across cancers and cohorts: a random forest against a taxonomy language model
Why a microbiome signal has to be tested cohort by cohort, what a random forest and a language model that reads species as words each bring to it, and why neither of them won everywhere.
Immune checkpoint inhibitors (ICIs) release a brake on the immune system and work against several cancers, yet only some patients benefit. The gut microbiome is a candidate predictor from outside the tumour, but studies in different hospitals and countries have tied response to different bacteria, and the abstract names differences between cohorts as the reason. A signal worth using has to survive a change of cohort, and ideally a change of cancer type.
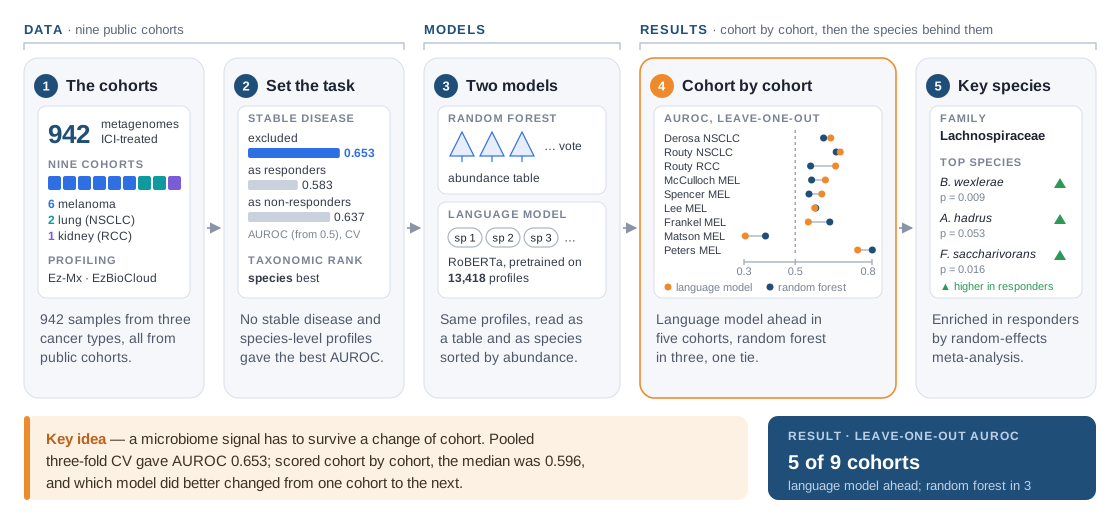
The study pooled 942 gut metagenomes from patients treated with ICIs for melanoma, non-small cell lung cancer (NSCLC) or renal cell carcinoma (RCC), drawn from nine public cohorts and profiled with the Ez-Mx platform against the EzBioCloud database. Two models predicted response: a random forest, and a RoBERTa-based language model that reads each sample as its species names in order of abundance, pretrained on 13,418 quality-controlled taxonomic profiles and then fine-tuned. Performance was measured as the area under the ROC curve (AUROC) under three-fold and leave-one-out cross-validation, each repeated 100 times.
Leaving out patients with stable disease and profiling at the species level gave the best AUROC. With those settings the language model scored higher than the random forest in five of the nine cohorts, the random forest in three, and one was a tie; Lachnospiraceae species, led by Blautia wexlerae, were among the strongest predictors. I am the third of ten authors, part of the CJ AI Center team that worked with CJ Bioscience researchers on predicting immunotherapy response from the microbiome; the first two authors are from CJ Bioscience, and the abstract does not list individual contributions. This post covers why the evaluation went cohort by cohort, what each model brings, and what a split verdict means.
Why one cohort is not enough
A gut microbiome profile is a long, sparse list of species whose abundances depend on diet, geography and medication, and on how samples were collected, sequenced and processed. All of that differs between cohorts, and so can the way response was judged. A random split puts patients from every cohort into every fold, so a model can learn those differences and report them as biology.
The study therefore used two schemes. Three-fold cross-validation mixes the samples, so test patients come from familiar cohorts. The leave-one-out results are reported for each named cohort, with a median across cohorts; the abstract does not spell out the unit left out, but that reporting reads as each cohort being scored on its own, the closer test for a biomarker meant for a new hospital. The gap shows: with stable disease excluded, AUROC was 0.653 under three-fold cross-validation and a median of 0.596 under leave-one-out. Repeating each scheme 100 times averages away the luck of any single split.
The label was tested too. Stable disease sits between response and progression, and counting it on either side blurred the signal: under cross-validation the AUROC was 0.583 with stable disease counted as response and 0.637 with it counted as non-response, against 0.653 without it, and the leave-one-out medians followed (0.573 and 0.575 against 0.596). Species-level profiles also beat every other taxonomic rank.
A random forest and a language model that reads species
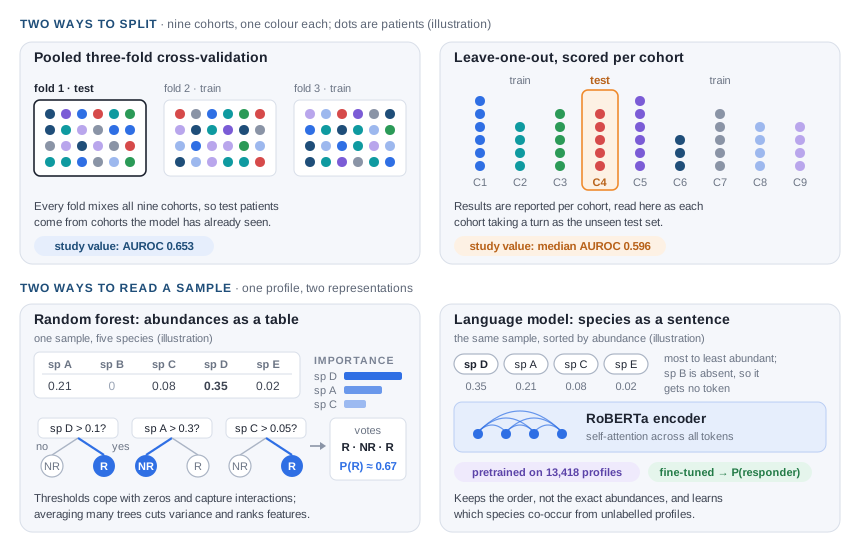
A random forest averages the votes of many decision trees, each grown on a resampled set of patients and a random subset of species. That suits a microbiome table: threshold splits make a rule such as "this species above some abundance" cheap to express, the many zeros cause no trouble, and interactions between species are found without being specified. Averaging decorrelated trees keeps the variance down when species far outnumber patients, and the forest ranks its features by contribution, turning a predictor into a list of candidates.
The language model reads the same sample as a sentence whose tokens are species names, sorted from most to least abundant. RoBERTa is a Transformer encoder, and its self-attention represents each species in the context of the others. Pretraining on 13,418 profiles, far more than the 942 labelled samples, lets it learn which species tend to occur together before it sees a response label; fine-tuning then adapts it to the response task. It gives up exact abundances, keeps their order, and gains community structure learned from unlabelled data, which a forest sees only through its splits.
Results
| Cohort, leave-one-out | Cancer | Language model AUROC | Random forest AUROC |
|---|---|---|---|
| Derosa 2022 | NSCLC | 0.639 | 0.611 |
| Routy 2018 | NSCLC | 0.676 | 0.660 |
| Routy 2018 | RCC | 0.658 | 0.560 |
| McCulloch 2022 | Melanoma | 0.618 | 0.564 |
| Spencer 2021 | Melanoma | 0.604 | 0.554 |
| Lee 2022 | Melanoma | 0.576 | 0.580 |
| Frankel 2017 | Melanoma | 0.551 | 0.635 |
| Matson 2018 | Melanoma | 0.305 | 0.384 |
| Peters 2019 | Melanoma | 0.744 | 0.801 |
The language model led in all three non-melanoma cohorts, the random forest in three melanoma cohorts. In Matson 2018 both scored below 0.5: patterns learned elsewhere ranked that cohort's patients worse than chance. Lachnospiraceae species stood out among the predictive features; in a random-effects meta-analysis, which pools cohorts while letting the true effect differ between them, Blautia wexlerae (p = 0.009), Anaerostipes hadrus (p = 0.053) and Fusicatenibacter saccharivorans (p = 0.016) were enriched in responders. The authors read the AUROCs as reasonable for a hard problem and the species as hints of a role in immune modulation.
What I learned
The evaluation scheme is part of the result. The same task scored 0.653 with cohorts shared between training and test and a median of 0.596 with each cohort scored on its own. For a biomarker meant for a new hospital the second number is the honest one, and per cohort it shows where a model breaks.
Label definitions can matter as much as model choice. Counting stable disease as response cost 0.07 of AUROC under cross-validation, more than the gap between the two models in six of the nine cohorts.
Two models that fail in different places are worth combining. The abstract reports no ensemble, but its split verdict is the classic argument for one: a tree model on abundances and a sequence model on species order make different mistakes, and averaging them is usually steadier than betting on either. The wider CJ work behind the poster is described in the immunotherapy-response project write-up.
Limitations
- Six of the nine cohorts are melanoma, so the comparison across cancer types rests on two NSCLC cohorts and one RCC cohort.
- The AUROCs are modest, range from below 0.5 to about 0.8, and come without intervals, so small gaps such as 0.576 against 0.580 are ties.
- The species are associations from observational cohorts, not yet evidence of a mechanism.
All numbers come from the published SITC 2024 abstract in the Journal for ImmunoTherapy of Cancer. The figures are drawn for this site, values marked as illustration are invented to explain the methods, and no patient-level data are shown or shared.