Alertness on eight-hour rotating shifts: hourly wearable scores from 82 nurses in a mixed model
How hourly alertness scores from a wrist actigraph, worn by 82 nurses for two weeks, were modelled with a random intercept for each nurse and shift-specific time slopes, and why that structure, rather than a regression on pooled hours, is what tells the day, evening and night patterns apart.
Most hospital nurses in South Korea work eight-hour shifts that rotate fast. The study cites a national survey in which 82.1% of hospital nurses work in such a system, moving between day, evening and night every two or three days. Night work in particular costs sleep and recovery time, and falling alertness is one route from tiredness to mistakes at the bedside. Yet most evidence on how alertness changes during a shift comes from 12-hour systems, and much of it from questionnaires or a single test at one point in time. The question here was narrower and more practical: inside an eight-hour shift, when does alertness drop, and is the pattern different on day, evening and night shifts?
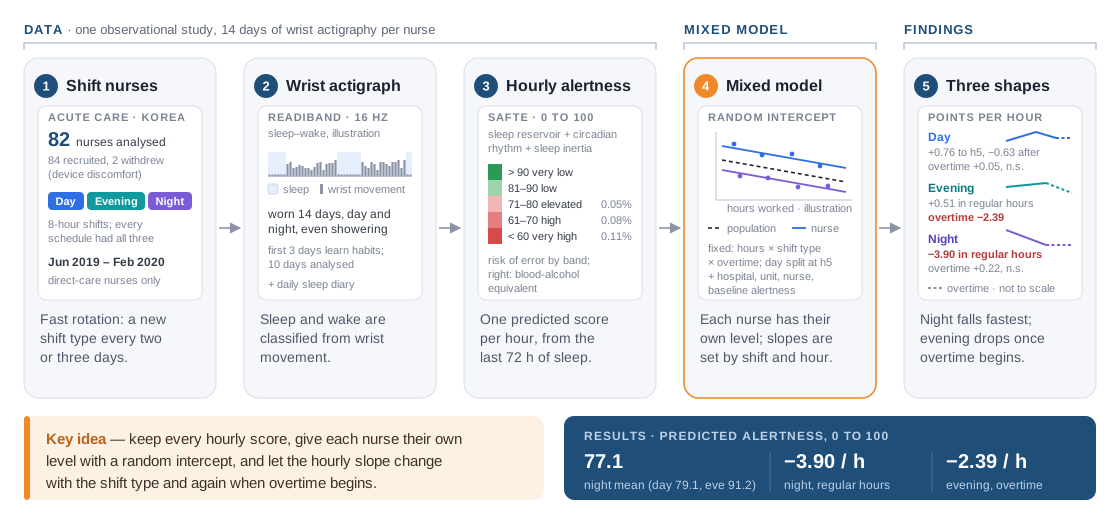
The data came from an observational study in acute care hospitals between June 2019 and February 2020. Eighty-four rotating-shift nurses were recruited and 82 completed it. Each wore a ReadiBand actigraph on the non-dominant wrist for 14 consecutive days and kept a sleep diary. From the sleep–wake record, the device's SAFTE algorithm predicts an alertness score for every hour; because it needs three days to learn each wearer's habits, ten days per nurse were analysed. That makes this repeated-measures data in the strict sense: many hourly scores per shift, several shifts per nurse, and nurses who differ from one another before any shift begins.
On average, alertness was lowest on night shifts (77.1), a little higher on day shifts (79.1) and highest on evening shifts (91.2), but the shapes differed more than the averages. Night-shift scores fell about 3.9 points for every regular hour worked and stayed low through overtime. Evening scores rose slowly, then dropped 2.4 points per hour once overtime began. Day scores climbed until the fifth hour and declined after it. I was the fourth author and applied the generalized linear mixed model that analyses these repeated measures; the article reports it as a mixed-effect linear model with a random intercept for each nurse. This post covers the data, why that model fits it, how the shift-specific slopes were built, and what the estimates say.
Fourteen days on the wrist
The ReadiBand is a wrist-worn accelerometer, sampling at 16 Hz, that classifies stretches of time as sleep or wake. Nurses wore it around the clock, at work, asleep and even in the shower. The research team checked the data every day, reminded participants through mobile chat, and at the end visited each nurse to collect the device and recheck their schedule in case shifts had changed. Because hospitals set different shift times, the start and end of every nurse's day, evening and night shifts were recorded, so working hours could be counted from their own shift start and split into regular and overtime hours.
Alertness is not observed directly. SAFTE (sleep, activity, fatigue and task effectiveness) is a biomathematical model that combines a homeostatic sleep reservoir, which drains while awake and refills during sleep, with a circadian rhythm and a short sleep-inertia term after waking. Its inputs are the time since the last sleep, the sleep obtained in the previous 72 hours and the time of day. The score runs from 0 to 100 with published risk bands: above 90 is very low risk; 71–80 is likened to a blood alcohol concentration of 0.05% with reactions 34% slower; 61–70 to 0.08% with reactions 55% slower; below 60 to 0.11%.
Two properties of this outcome shaped the analysis. It is roughly continuous, so a linear model on the score itself is reasonable. And it comes from a running reservoir, so neighbouring hours from the same nurse are far from independent: a nurse who slept badly before a shift starts lower and tends to stay lower. A companion study on the same nurses asks which pre-shift sleep measures and fatigue drive those differences; I wrote it up in Sleep, fatigue and alertness on rotating shifts.
Why a mixed model, and what the random intercept does
A regression on all hourly scores pooled together would treat thousands of rows as if they came from thousands of people. They came from 82. Hours from the same nurse share their sleep history, their unit and their habits, so a pooled regression overstates how much independent information there is and reports standard errors that are too small. It also lets stable differences between nurses, one who usually sits near 85 and another near 75, leak into its estimate of how scores change over a shift.
A generalized linear mixed model handles this by splitting the variation in two. The fixed effects describe the population: the slope per working hour, the differences between shift types, and covariates for the hospital, the unit and the nurse, plus baseline alertness. The random intercept gives each nurse their own level, treated as a draw from a normal distribution around the population mean. What remains is within-nurse noise. The variance of the random intercepts measures how much nurses differ from each other; the residual variance measures how much a nurse's hours scatter around their own line. Two hours from the same nurse share that nurse's intercept, and that shared term is exactly the within-person correlation a pooled model ignores.
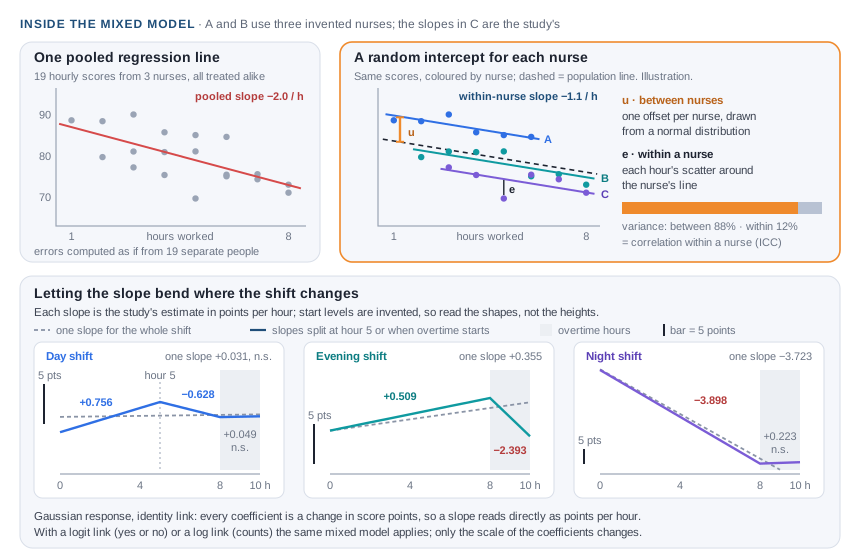
The model belongs to the generalized family, but here the generalization is simple. Alertness is continuous, so the response is Gaussian and the link is the identity, which is why the article calls it a mixed-effect linear model; the same machinery takes a logit link for a yes-or-no outcome or a log link for counts. Three characteristics made it fit this data. It keeps every hour instead of averaging each nurse down to one number, so the shape of the curve within a shift survives. It copes with unbalanced data: nurses worked different numbers of each shift type and different amounts of overtime, and the likelihood simply uses what each nurse contributed. And it borrows strength across nurses: a nurse with few night shifts still gets a sensible level, pulled towards the population mean in proportion to how little data they have.
Letting the slope change where the shift changes
The interesting answer is not one slope but several. The models therefore added interaction terms between working hours and shift type, and between working hours and an overtime indicator, so that each shift has its own slope in regular hours and another once overtime begins. For day shifts the regular hours were further split at the five-hour mark, because the scores rose first and fell later; one straight line would have averaged a rise and a fall into almost nothing. A supplementary analysis added interactions with a low-alertness indicator, scores below 70 or below 80, to test whether the decline is steeper once a nurse is already in a risk zone.
Every model adjusted for baseline alertness and for hospital, unit and nurse characteristics. That matters when reading the shift contrasts: they compare shifts for nurses starting from the same alertness, which is a different question from comparing raw averages.
Results
Across all working hours the overall trend was downward, 1.26 points per hour. The table gives changes in the score per hour worked, except the two level contrasts; the article reports standard errors rather than confidence intervals.
| Term | Estimate | SE | p |
|---|---|---|---|
| All shifts, per hour | −1.255 | 0.026 | < 0.001 |
| Night vs day, level | −18.931 | 0.315 | < 0.001 |
| Evening vs day, level | −1.389 | 0.278 | < 0.001 |
| Day, regular hours to hour 5 | +0.756 | 0.036 | < 0.001 |
| Day, regular hours from hour 5 | −0.628 | 0.030 | < 0.001 |
| Day, overtime | +0.049 | 0.089 | 0.584 |
| Evening, regular hours | +0.509 | 0.017 | < 0.001 |
| Evening, overtime | −2.393 | 0.097 | < 0.001 |
| Night, regular hours | −3.898 | 0.040 | < 0.001 |
| Night, overtime | +0.223 | 0.198 | 0.261 |
The mean score across regular and overtime hours was 82.66 (SD 6.52). Day-shift scores stayed around 80 and never fell below 70; they were lowest at the start, which the authors connect to day shifts beginning around 6 or 7 a.m. Evening scores stayed above 80 on average but dropped sharply in overtime. Night scores fell below 70 on average by the end of regular hours and stayed there. The decline was steeper when scores were already below 70 (−0.462 per hour) or below 80 (−0.718 per hour). For context, the authors cite a US study in which nurses on fixed 12-hour shifts averaged 86.15 on the same score, and read the gap as a sign that rotating eight-hour schedules may carry greater risk.
What I learned
Count the people, not the rows. Ten days of hourly scores look like a large dataset, but the unit that was sampled is the nurse. A random intercept is the smallest change that makes a model respect that: it keeps every hour, and lets the uncertainty reflect 82 people.
Let the slope bend where the work changes. The day-shift rise and fall and the evening drop in overtime are invisible to a single straight line. Interactions and a split at the five-hour mark turned one averaged slope into a description of each shift, which is what a nurse manager can act on.
Adjusted and raw comparisons answer different questions. Evening shifts have by far the highest raw average, yet with baseline alertness held fixed the evening–day contrast is slightly negative. Neither number is wrong: the first describes the shifts as they are worked, the second compares them for nurses who start from the same place.
Limitations
- The outcome is a model prediction from sleep–wake data. The authors caution that evidence linking low SAFTE scores to impaired cognitive performance in nurses is still scarce, so a low score is not an observed error rate.
- Health conditions that can affect alertness, such as anxiety, depression or sleep disorders, were not included.
All numbers are from the published article (Journal of Nursing Scholarship 54(4): 403–410, 2022). The figures are my own drawings, not the article's; values marked as illustration are invented. No participant-level data are shared here.