Sleep and fatigue before a shift as drivers of nurse alertness: wrist actigraphy and linear mixed models
How four sleep measures from a wrist actigraph and a fatigue rating taken at the start of each shift were linked to hourly alertness in 82 nurses, using mixed models that compare each nurse with themselves and then test whether the links change once alertness falls below 70.
Rotating shifts disturb the body clock, shorten sleep between shifts and leave nurses tired when the next one starts; the lower alertness that follows is linked to medication, procedural and documentation errors, injuries at work and car accidents on the way home. In South Korea most hospital nurses work eight-hour shifts that change from day to evening to night every two to three days, average about 47 hours a week, and rarely get a regular break. Most of what is known about sleep and alertness comes from 12-hour systems and from questionnaires. This study asked a more specific question: which features of the sleep before a shift, and how tired a nurse feels as it begins, go with their alertness during that shift, and does the answer differ for day, evening and night shifts?
The data come from the same observational project as the companion study I wrote up in Alertness on eight-hour rotating shifts. Eighty-four nurses from acute care hospitals took part between June 2019 and February 2020, and 82 provided valid data; two stopped because the device was uncomfortable. Each wore a ReadiBand actigraph for 14 days. Its minute-by-minute sleep–wake record gave four sleep measures for the sleep before each shift and, through the SAFTE algorithm, a predicted alertness score for every hour. Before and after every shift the nurses also rated their fatigue on a 10-point scale through a mobile link. The companion post asks how alertness changes hour by hour on each shift; this one asks what the sleep and fatigue a nurse brings to the shift have to do with it.
Sleep before night shifts averaged 5.3 hours, about an hour and a half less than before day (6.8) or evening (6.9) shifts, and fatigue at the start of a shift was highest before day shifts (6.6 on the 10-point scale). In the alertness models, more sleep went with higher alertness overall; on night shifts sleep quantity and wake after sleep onset mattered, on day shifts the fatigue rating did, and in hours when alertness had fallen below 70 several sleep measures showed different, mostly steeper links. I was the fourth author and one of three who carried out the data analysis, using mixed models that account for differences between nurses and for repeated observations over time. This post covers the measures, why mixed models fit two kinds of repeated data at once, and what the estimates say.
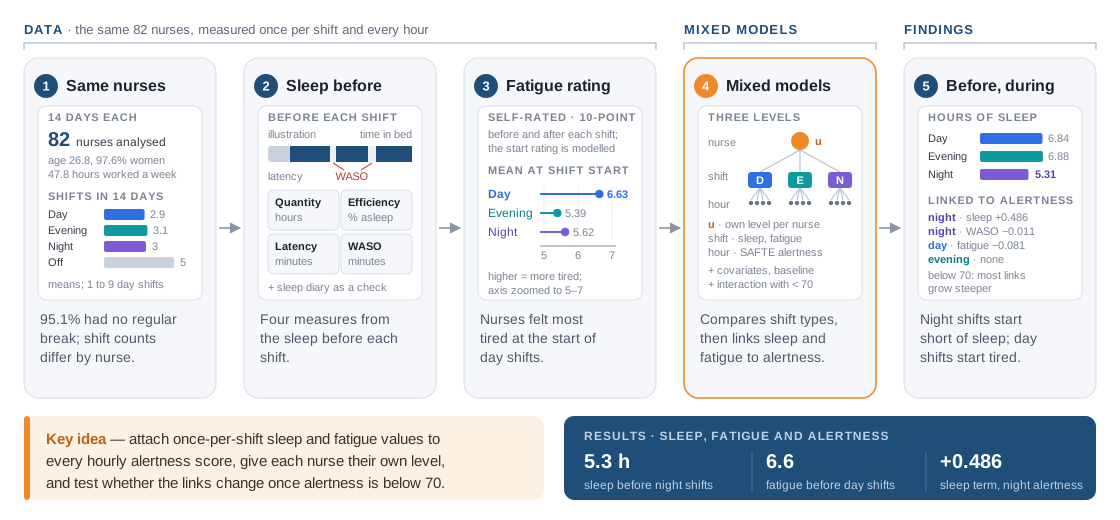
A night's sleep, read from the wrist
The ReadiBand records wrist movement and classifies each minute as sleep or wake. From that record the study took four measures for the sleep period before each shift: sleep quantity, the total time asleep; sleep efficiency, the share of the time in bed actually spent asleep; sleep latency, the minutes it took to fall asleep; and wake after sleep onset (WASO), the minutes spent awake once sleep had begun. The models used the fatigue rating given at the start of the shift; a higher score means more tired.
The nurses were young: on average 26.8 years old with 3.7 years of experience, 97.6% women, working 47.8 hours a week. During the two weeks a nurse worked on average 2.9 day, 3.1 evening and 3 night shifts and had 5 days off, but the counts ranged from 1 to 9 day shifts and 1 to 7 night shifts. Almost all (95.1%) had no regular break; the average break, meals included, on their last shift was 16.3 minutes. Those uneven counts matter for the analysis, because any method that needs the same number of shifts per nurse would have to discard data.
One model, two kinds of repeated measurement
The analysis used mixed models twice. The first compared sleep and fatigue across shift types. Each nurse contributes one or more sleep periods before each kind of shift, and nurses differ in how much they habitually sleep. A random intercept gives every nurse their own baseline level, so the day, evening and night contrasts are estimated from differences within each nurse rather than between nurses with different habits. This is the same question a repeated-measures analysis of variance answers, but the mixed model accepts that one nurse had a single night shift and another seven without dropping anyone.
The second use is the harder one. The outcome, alertness, is measured every hour, while the predictors, the sleep before the shift and the fatigue rating at its start, are measured once per shift. Every hour of a shift therefore carries the same sleep and fatigue values, and every shift belongs to one of 82 nurses. A regression on pooled hours would treat each hour as fresh evidence about sleep, when the sleep measure only changed once per shift. The mixed model keeps every hourly score, adds a random intercept for each nurse so that their hours share a common level, and attaches the shift-level measures to the hours they precede.
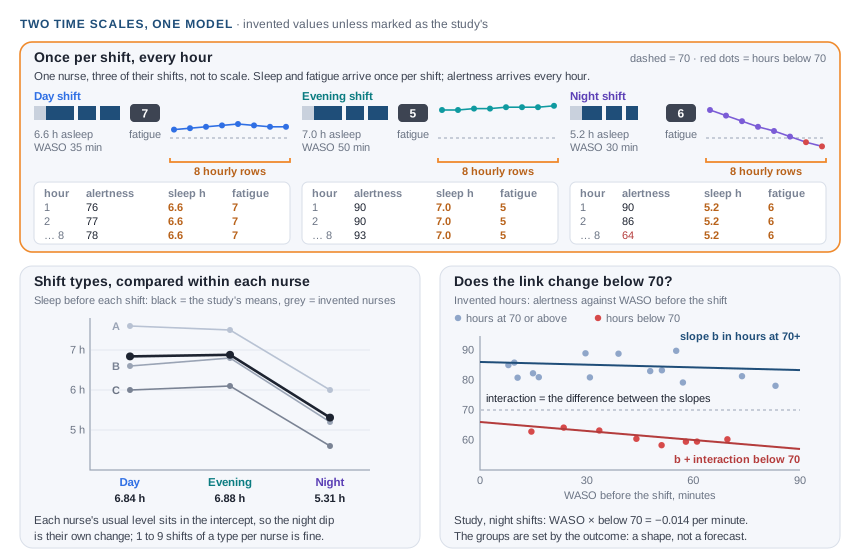
All models adjusted for hospital, unit and nurse characteristics, from hospital size and teaching status to age, experience, recent working hours and night shifts, and for baseline alertness. That last adjustment changes what a coefficient means. With the baseline level held fixed, an estimate describes how alertness moves beyond where it started, which is why the article reads the estimates as effects on the decline in alertness.
As in the companion analysis, this is the simplest member of the generalized linear mixed model family: alertness is roughly continuous, so the response is Gaussian with an identity link and the coefficients are in score points. A logit or a log link would carry the same random-effects structure to a yes-or-no outcome or to counts.
Does the link change below 70?
A score of 61 to 70 is the high-risk band of the SAFTE scale, likened to a blood alcohol concentration of 0.08% with reaction times 55% slower. The second set of models added, for each measure, an interaction with an indicator for hours in which alertness was below 70. The interaction coefficient is the difference between two slopes: how strongly alertness moves with, say, sleep efficiency during low-alertness hours, compared with the remaining hours. A positive value for a measure that helps, like efficiency, or a negative one for a measure that hurts, like latency or WASO, means the measure matters more once a nurse is already in the risk zone.
Results
The first table gives the means before each shift type; all five differed across shift types (F from 16.3 to 393.1, p < 0.001).
| Before the shift | Day | Evening | Night |
|---|---|---|---|
| Sleep quantity, hours | 6.84 | 6.88 | 5.31 |
| Sleep efficiency, % | 81.7 | 80.6 | 79.6 |
| Sleep latency, minutes | 30.0 | 25.6 | 20.0 |
| Wake after sleep onset, minutes | 38.1 | 48.4 | 32.2 |
| Fatigue at shift start, 10-point scale | 6.63 | 5.39 | 5.62 |
The second table gives selected estimates from the alertness models; the article reports standard errors rather than confidence intervals.
| Model term | Estimate | SE | p |
|---|---|---|---|
| All shifts, sleep quantity | +0.136 | 0.046 | 0.003 |
| Day shifts, fatigue rating | −0.081 | 0.026 | 0.002 |
| Night shifts, sleep quantity | +0.486 | 0.076 | < 0.001 |
| Night shifts, WASO | −0.011 | 0.004 | 0.015 |
| Below 70, all shifts, sleep efficiency | +0.046 | 0.017 | 0.009 |
| Below 70, all shifts, sleep latency | −0.021 | 0.010 | 0.037 |
| Below 70, all shifts, fatigue rating | +0.493 | 0.099 | < 0.001 |
| Below 70, evening, sleep quantity | +3.849 | 0.787 | < 0.001 |
| Below 70, night, sleep quantity | −0.308 | 0.120 | 0.010 |
Across all nurses sleep averaged 6.6 hours, below the seven hours recommended for adults, with a mean efficiency of 80.3% against a healthy level of about 85% and a mean latency of 28.6 minutes. The authors contrast this with earlier studies of nurses on fixed 12-hour shifts, who slept about 7.1 hours with no difference between day and night workers. No measure was linked to alertness on evening shifts in the main models. Below 70, more measures came into play: sleep efficiency and WASO on day shifts; sleep quantity, efficiency and WASO on evening shifts; and sleep quantity, latency and WASO on night shifts. The authors' practical reading is to reduce fatigue at the start of day shifts, guarantee rest periods between shifts and limit mandatory overtime, and plan the direction of rotation and the number of consecutive shifts with recovery in mind.
What I learned
Two clocks can live in one model. Sleep and fatigue change once per shift, alertness every hour, and both sit inside nurses. A mixed model holds all three levels without averaging any of them away. A random intercept for the nurse handles the largest source of correlation; with predictors that change once per shift, a second random intercept for the shift is the natural extension I would test next time.
Know where each measure comes from. SAFTE estimates alertness from the sleep and wake pattern recorded by the same wrist device that also gives the sleep measures, so sleep and alertness share an instrument. The fatigue rating comes from the nurses themselves, which is why its association on day shifts adds independent information. Keeping track of which variables share a source is part of reading any wearable study.
Low-range terms describe the low range. The below-70 indicator is defined on the alertness score itself, so its interactions describe how sleep and fatigue relate to alertness once it is already low. Predicting who enters that range is a different question, and a natural one for a follow-up study.
Limitations
- Fatigue has several dimensions, such as acute fatigue, chronic fatigue and recovery between shifts, but it was measured as a single rating before and after each shift.
- Health status, such as the menstrual phase and medical history, physical or psychological illness, and family responsibilities, all of which can affect sleep and alertness, were not controlled.
- The participants were young, probably because they were recruited through an online scheduling app, so the results may not carry over to older nurses.
All numbers are from the article's accepted manuscript; where its text and tables differ, the table values are used. The figures are my own drawings, not the article's, and values marked as illustration are invented. No participant-level data are shared here.