Who comes back to hospital: 30-day readmission as a time-to-event outcome, modelled with Cox regression
Why a 30-day readmission study is a survival analysis in disguise, and how a Cox model with a fixed 30-day window, a proportional-hazards check and a short list of risk factors recorded at discharge points to where a discharge programme should start.
Readmissions within a month of discharge are costly, often preventable and increasingly treated as a measure of care quality. In 2013 the US Centers for Medicare and Medicaid Services began penalising hospitals with higher-than-expected readmission rates for acute myocardial infarction (AMI), chronic obstructive pulmonary disease (COPD), heart failure and pneumonia, later adding coronary artery bypass graft (CABG) surgery and hip and knee replacement; with stroke, seven conditions are now tracked as a hospital quality index. Korea moved to publish readmission rates for its general and tertiary hospitals in 2016. The practical goal is to recognise high-risk patients before they leave and support them at discharge, which is what screening tools such as the LACE index, the HOSPITAL score and the 8Ps assessment from the Society of Hospital Medicine try to do.
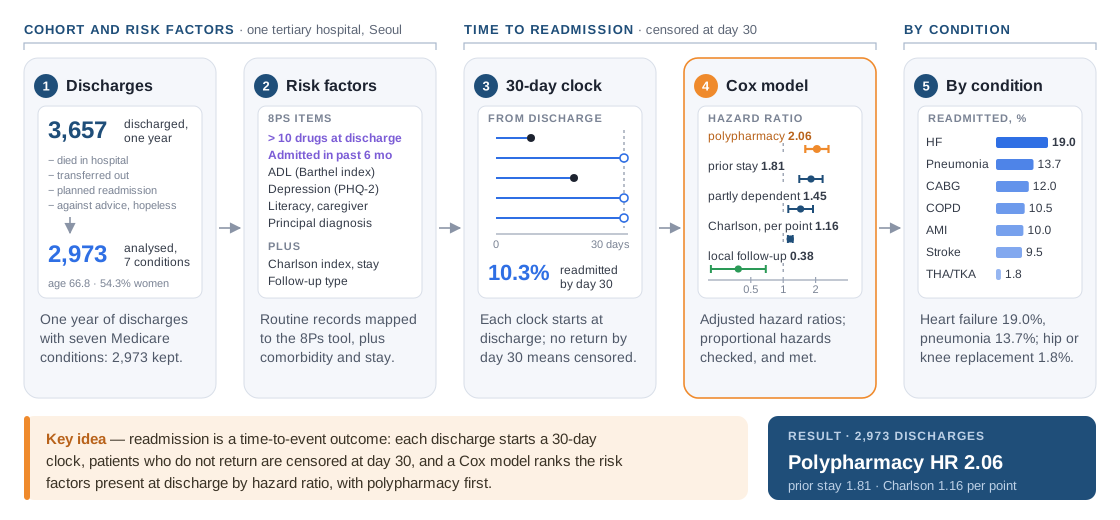
The study took one year of discharges, April 2016 to March 2017, from a 2,100-bed tertiary referral hospital in Seoul, restricted to the seven Medicare conditions. Of 3,657 discharged patients, those who died in hospital, were transferred to another facility, were discharged as hopeless or against medical advice, or had a planned readmission were excluded, leaving 2,973. The electronic medical record supplied the risk factors, mapped as far as possible onto the 8Ps tool, and the outcome was all-cause readmission within 30 days.
One in ten patients (10.3%) came back within 30 days, from 19.0% after heart failure to 1.8% after hip or knee replacement. In a Cox model, taking more than ten medications at discharge roughly doubled the readmission hazard (HR 2.06, 95% CI 1.60–2.64), a hospital stay in the previous six months raised it by 81% (HR 1.81, 1.41–2.32), and each point on the Charlson comorbidity index raised it by 16% (HR 1.16, 1.11–1.23). As second author I treated readmission as a time-to-event outcome and applied Cox proportional hazards modelling to identify these risk factors. This post covers the cohort, why a Cox model suits a 30-day outcome, and what the estimates suggest for discharge planning.
Seven conditions, one year of discharges
The final cohort held 769 patients with pneumonia, 591 with stroke, 566 after hip or knee replacement, 392 with AMI, 295 with heart failure, 208 after CABG and 152 with COPD. Their mean age was 66.8 years, and 54.3% were women.
The risk factors came from routine records. Polypharmacy meant more than ten drugs at discharge; depression a score of at least three on the two-item Patient Health Questionnaire at admission; physical limitation the Modified Barthel Index of activities of daily living; poor literacy difficulty reading and writing; social support whether a caregiver was available after discharge; and prior hospitalisation any admission in the six months before. Palliative care, the eighth P, had no usable record. Comorbidity was summarised by the Charlson index, a weighted count over 17 disease groups that ranges from 0 to 29, alongside the length of stay and the type of follow-up arranged after discharge.
The crude comparisons already pointed at the same factors. Readmitted patients had a higher mean Charlson score (2.26 against 1.24) and longer index stays (13.4 against 9.3 days); 16.6% of patients with polypharmacy were readmitted against 6.0% of those without, and 20.8% of patients with a recent hospitalisation against 8.2%. Depression, literacy and social support showed no association, but only 18 patients screened positive for depression and 14 for poor literacy, and none of them were readmitted. Variables significant in the log-rank tests and univariate Cox models, together with factors known from earlier studies, went into the final model.
Why a Cox model for a 30-day outcome
A 30-day readmission looks like a yes-or-no outcome, and logistic regression is the usual tool. But readmission is also an event in time: a patient who returns on day 3 and one who returns on day 28 both count as readmitted, yet they say different things about the discharge. Treating readmission as time to event uses that information. Every patient's clock starts at discharge; patients who come back contribute an event on the day they are readmitted, and patients who do not are censored at day 30, the end of the window.
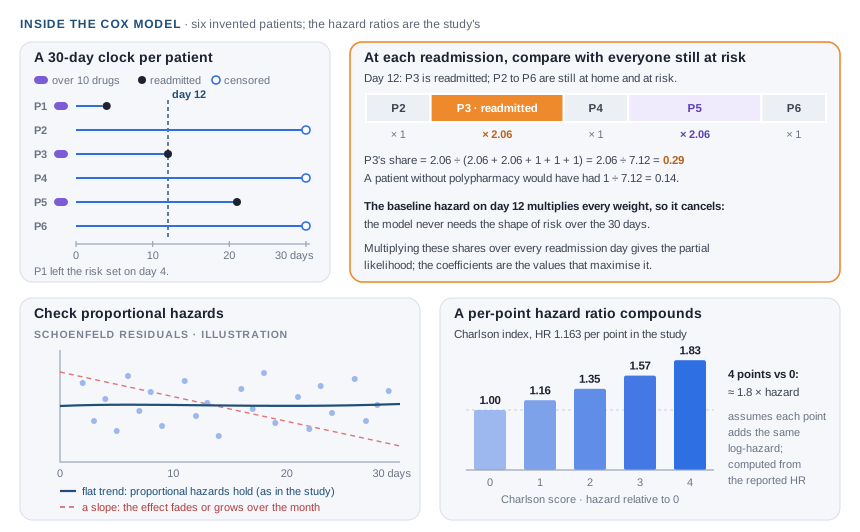
The Cox proportional hazards model estimates how each factor scales the hazard, the instantaneous readmission rate among patients still at home. It does so through the partial likelihood: at each readmission it asks how likely it was that this particular patient, rather than anyone else still at risk that day, was the one readmitted, given everyone's risk factors. The baseline hazard, the shape of risk over the 30 days, multiplies every patient's weight equally and cancels out of each comparison, so it never has to be specified, whatever shape the risk takes over the month.
What the model does assume is proportional hazards: a factor's effect is a constant multiple of the hazard across the window. The study tested this with scaled Schoenfeld residuals, whose trend over time would reveal an effect that fades or grows, and found the assumption met. Multicollinearity was checked as well, and no pair of predictors correlated above 0.3, so the hazard ratios are not artefacts of near-duplicate variables. A logistic regression on the same data gave similar findings, a useful check that the conclusions do not hinge on the modelling frame.
Continuous covariates deserve a note. The Charlson index entered the model as a number, so its hazard ratio of 1.16 applies per point and compounds: under the model's log-linear form, a patient scoring 4 has about 1.8 times the readmission hazard of a patient scoring 0, all else equal.
Results
Adjusted hazard ratios for 30-day readmission from the Cox model (2,973 patients):
| Factor | HR | 95% CI | p |
|---|---|---|---|
| Polypharmacy, more than 10 drugs at discharge | 2.06 | 1.60–2.64 | < 0.001 |
| Hospitalised in the previous 6 months | 1.81 | 1.41–2.32 | < 0.001 |
| Charlson comorbidity index, per point | 1.16 | 1.11–1.23 | < 0.001 |
| Partially dependent in daily activities, vs independent | 1.45 | 1.12–1.89 | 0.004 |
| Follow-up at a local hospital, vs outpatient clinic | 0.38 | 0.21–0.69 | 0.001 |
| Length of stay, per day | 1.01 | 1.00–1.02 | 0.066 |
Sex, age and full dependence in daily activities were not independently associated once the other factors were in the model. Readmission differed clearly by condition (log-rank p < 0.001), from 19.0% for heart failure and 13.7% for pneumonia to 1.8% after hip or knee replacement. The authors single out polypharmacy as the strongest factor and recommend that discharge programmes for patients with polypharmacy, a recent admission or heavy comorbidity include medication reconciliation, a formal check of the complete medication list against the orders, delivered by a multidisciplinary team. At the time, neither this hospital nor Korean hospitals in general offered such programmes in systematic form.
What I learned
A binary outcome often hides a time-to-event one. Framing readmission as time to event made censoring explicit and turned the effect of each factor into a rate ratio over the window. That the logistic model agreed was reassuring rather than redundant.
Check the assumption the hazard ratio rests on. A single hazard ratio for polypharmacy is a fair summary only if its effect is steady across the month. The Schoenfeld residual test is cheap and belongs in every Cox analysis.
Read rare categories with care. Depression and poor literacy had no readmissions among 18 and 14 patients. That is not evidence of protection, only too few patients to estimate anything, and their absence from the final model says more about how well routine records capture these risks than about the risks themselves.
Limitations
- Some record-based variables only approximated the 8Ps concepts: social support was simply the presence of a caregiver, and palliative care could not be measured.
- There was no sensitivity analysis restricted to readmissions related to the primary diagnosis, and condition-specific risk factors could not be modelled in detail.
- Socioeconomic status, distance from the hospital and access to primary care were not available, and results from a single tertiary hospital may not generalise.
All numbers are from the published article. The figures are drawn for this site, and values marked as illustration are invented to explain the method; no patient-level data are shown or shared.