Low-dose pirfenidone in idiopathic pulmonary fibrosis: survival and lung-function decline in a real-world cohort
How a real-world cohort asks whether a reduced dose of an antifibrotic still helps: Kaplan–Meier curves that respect unequal follow-up, a Cox model that adjusts for the treated patients being sicker at baseline, and annual lung-function slopes for patients with repeated tests.
Idiopathic pulmonary fibrosis (IPF) is a chronic, progressive scarring of the lungs with no known cause. Breathlessness worsens, lung function is lost for good, and median survival from diagnosis is two to four years. Pirfenidone, an oral antifibrotic, slowed disease progression in the CAPACITY and ASCEND trials at 2,403 mg per day. In everyday practice that dose is often out of reach: gastrointestinal and skin side effects lead to dose reductions, and in South Korea, where a tablet holds 200 mg, the full recommended dose is 1,800 mg per day. Whether 1,200 mg or less still works has not been settled, and that uncertainty makes clinicians hesitant to keep patients on a reduced dose.
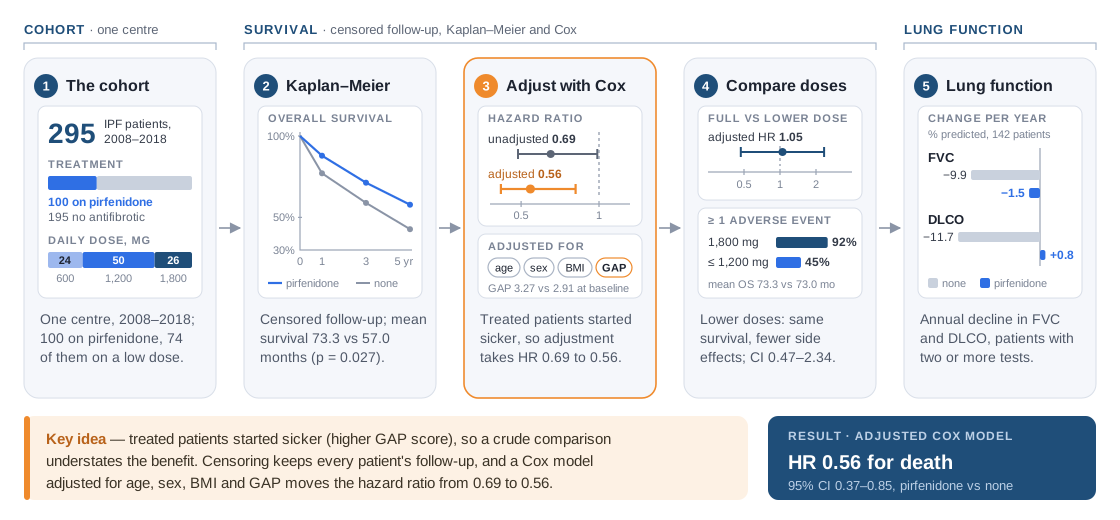
The study included every patient diagnosed with IPF at one university hospital in Korea between 2008 and 2018. Clinical, lung-function and imaging data were collected at set times under the centre's protocol for interstitial lung disease and later reviewed. Of 295 patients, 100 received pirfenidone and 195 received no antifibrotic drug; among the treated, 24 took 600 mg, 50 took 1,200 mg and 26 took 1,800 mg per day. Overall survival was compared with Kaplan–Meier estimates and Cox proportional hazards models, and the annual decline in lung function was compared for the 142 patients with at least two pulmonary function tests.
Pirfenidone was associated with longer survival: a mean of 73.3 months against 57.0 without antifibrotic treatment, and a hazard ratio of 0.69 (95% CI 0.48–0.99) that strengthened to 0.56 (0.37–0.85) after adjusting for age, sex, body mass index and the GAP severity score. Patients on 1,200 mg or less did no worse than those on the full dose (adjusted hazard ratio 1.05, 0.47–2.34), and treated patients lost lung function far more slowly. As second author I contributed the survival analysis. This post covers how the cohort came together, why the survival methods fit it, and what the estimates can and cannot say about dose.
A cohort shaped by reimbursement, not randomisation
Who received pirfenidone was decided by clinical practice and by the insurance system. The drug was approved in Korea in 2012 but reimbursed only from October 2015, and then only for patients with a definite diagnosis on high-resolution CT or surgical lung biopsy and lung function that was no longer preserved. Most untreated patients were diagnosed before that date, and many early, still-well patients stayed untreated because they did not meet the criteria.
Dose was not assigned either. Treatment started at 200 mg three times a day and was raised towards 1,800 mg over two to four weeks; patients who could not tolerate the full dose because of side effects stayed on 600 or 1,200 mg, at the physician's discretion. The low-dose group is therefore defined by tolerance, which makes it a selected group rather than a random one.
The baseline table shows the consequences. Compared with untreated patients, the treated group had more men (81.0% against 61.5%), more current or former smokers (75.0% against 57.4%) and a higher GAP score (3.27 against 2.91). GAP combines gender, age and two lung-function measures, forced vital capacity (FVC) and diffusing capacity for carbon monoxide (DLCO), into stages with estimated one-year mortality of 5.6%, 16.2% and 39.2%. By that yardstick the treated patients started out sicker, so a raw comparison of outcomes is tilted against the drug.
Survival under unequal follow-up: Kaplan–Meier, then Cox
Enrolment ran over ten years, so a patient diagnosed early could be followed for most of a decade and one diagnosed in 2018 only briefly, and patients still alive at their last contact have no date of death. Counting the proportion who died would mix the effect of treatment with the effect of follow-up length, and follow-up length is not balanced here, because most untreated patients were diagnosed before antifibrotics were reimbursed. Survival analysis treats these patients as censored: their time counts for as long as they were observed, and no longer.
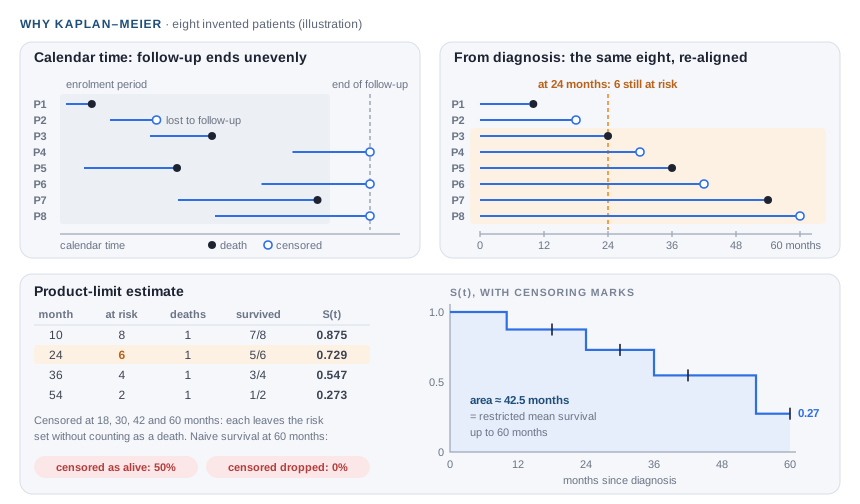
The Kaplan–Meier estimator does this without assuming any shape for the survival curve. At each death it multiplies the running survival probability by the fraction of patients still at risk who survived that moment, and a censored patient leaves the risk set when their follow-up ends, without counting as a death or as a survivor beyond that point. A Kaplan–Meier mean survival time, such as the 73.3 and 57.0 months here, is the area under the estimated curve, a summary of the whole curve rather than of one time point.
The Cox proportional hazards model then compares groups through a hazard ratio, the ratio of their instantaneous death rates. Its baseline hazard is left unspecified, which suits a disease whose course the article describes as variable and unpredictable; what it does assume is that the ratio between groups stays roughly constant over follow-up. Its other strength is adjustment: with age, sex, BMI and GAP score in the model alongside treatment, the comparison is between patients who are alike on those characteristics. That is why the hazard ratio moved from 0.69 to 0.56 after adjustment rather than towards 1. The treated group's worse baseline profile had been hiding part of the association.
The same model compared doses within the 100 treated patients, the full 1,800 mg against 600 or 1,200 mg. Side effects separated the dose groups clearly, with 92.3% of full-dose patients reporting at least one adverse event against 44.6% on lower doses, but survival did not.
Results
| Comparison | Estimate | 95% CI | p |
|---|---|---|---|
| Mean overall survival, pirfenidone vs none | 73.3 vs 57.0 months | — | 0.027 |
| Hazard ratio, pirfenidone vs none, unadjusted | 0.69 | 0.48–0.99 | 0.042 |
| Hazard ratio, pirfenidone vs none, adjusted | 0.56 | 0.37–0.85 | 0.006 |
| Hazard ratio, full vs lower dose, adjusted | 1.05 | 0.47–2.34 | 0.905 |
| Annual change in FVC, % predicted, pirfenidone vs none | −1.5 vs −9.9 | — | < 0.001 |
| Annual change in DLCO, % predicted, pirfenidone vs none | +0.8 vs −11.7 | — | 0.007 |
Fixed horizons pointed the same way: one-year mortality was 12.1% with pirfenidone against 22.9% without, and five-year survival 57.8% against 42.8%. Among the 87 untreated and 55 treated patients with repeated tests, FVC, FEV1 and DLCO all declined less with pirfenidone. The low-dose subgroup on its own (36 patients) also differed from untreated patients, losing 1.2 rather than 9.9 points of predicted FVC a year, and did not differ from the full-dose group on any lung-function measure. The authors conclude that when the full dose is not tolerated, reducing it is preferable to stopping treatment.
What I learned
Censoring is information, not missing data. In a cohort assembled over a decade, follow-up length is tied to calendar time, and calendar time is tied to treatment through reimbursement. Treating living patients as censored, rather than as survivors or as missing, was the first step towards a fair comparison.
Adjustment can move an estimate away from the null. It is tempting to expect adjusted effects to shrink. Here the treated group started sicker, so adjusting for the GAP score strengthened the association. Reading the baseline table before the model is what makes the direction of the change interpretable.
No difference is not the same as equivalence. The dose comparison's interval runs from 0.47 to 2.34, compatible with anything from roughly halving to more than doubling the death rate on the full dose. With 26 full-dose patients, the result supports a lower dose as a reasonable option, not as a proven equal, which is exactly the gap a formal equivalence design such as my relative-distance work on biosimilars is built to close.
Limitations
- The design is retrospective and single-centre, so selection bias and unknown confounders cannot be ruled out.
- Pulmonary function tests were repeated only a few times and at irregular intervals, which made progression-free survival impossible to analyse.
- Acute exacerbations, which may contribute to mortality, were not examined.
All numbers are from the published article. The figures are drawn for this site, and values marked as illustration are invented to explain the method; no patient-level data are shown or shared.